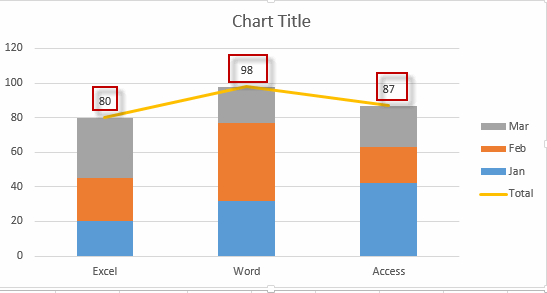
This post will guide you how to add total data labels to the Excel Stacked Column Chart. How do I add totals to stacked charts for readability in Excel. How to create a stacked bar chart with total data labels in Excel. How to add total labels to a stacked column or bar chart in Excel 2013/2016.
Add Total Labels to Stacked Chart
Assuming that you have created a stacked column chart based on the source data in your current worksheet, and also contain one total column in the data. and how to convert Total series to Total Labels only in the Stacked Column Chart. just do the following steps:
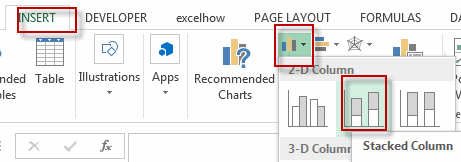
#1 select the source data in your worksheet, go to INSERT tab, click Column command under Chart group. and select the stacked column under 2-D column section from the pop-up list box. A stacked column chart has been generated based on your selected data source in your worksheet.
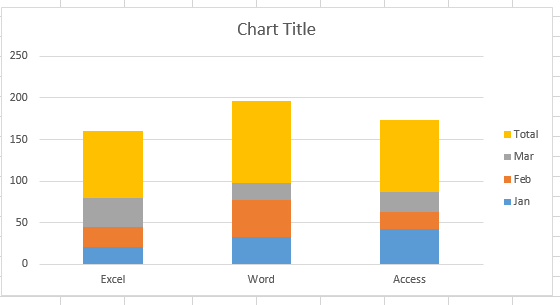
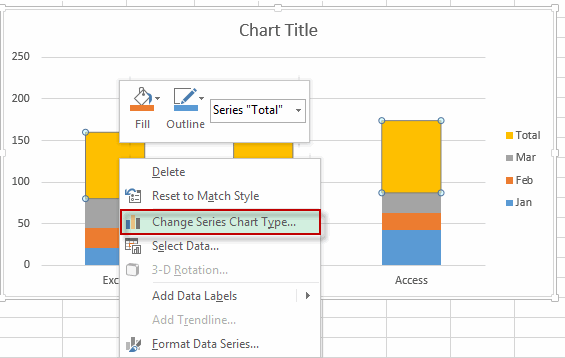
#2 click the Total series on the chart, and right click on the selected total series, and select Change Series chart Type item from the pop-up menu list. the Change Chart Type dialog will open.
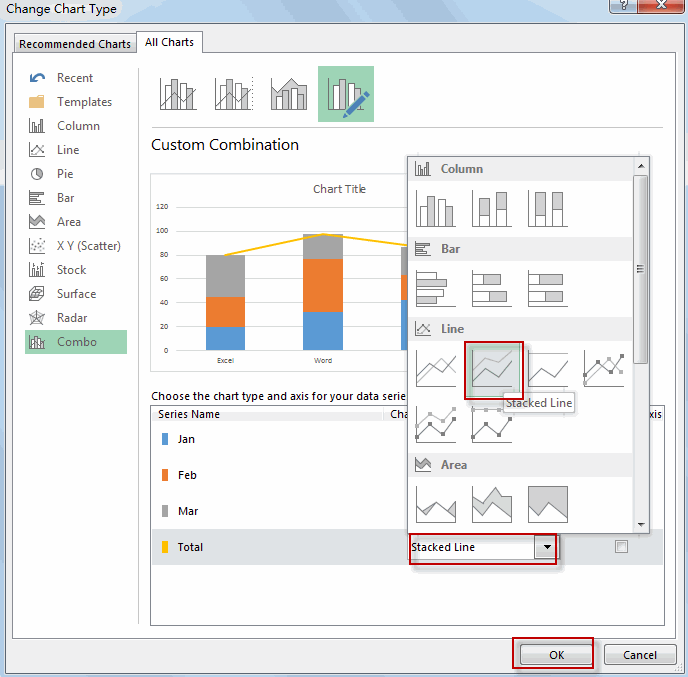
#3 Click Combo tab, Change the chart type for Total Series from Stacked Column to Stacked Line. And select one Stacked line chart as your new chart type . click OK button.
#4 The Total series has been changed to the line chart type.
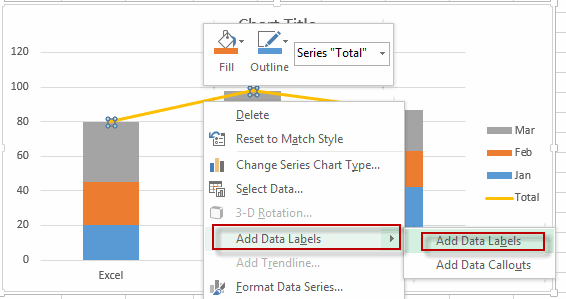
#5 click the Total Series to select it, and right click on it, and select Add Data Labels from the pop-up menu list.
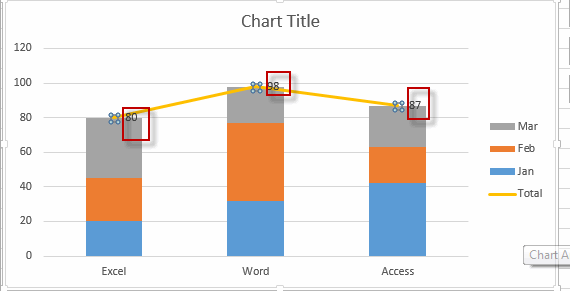
#6 the data labels have been added into the Total series.
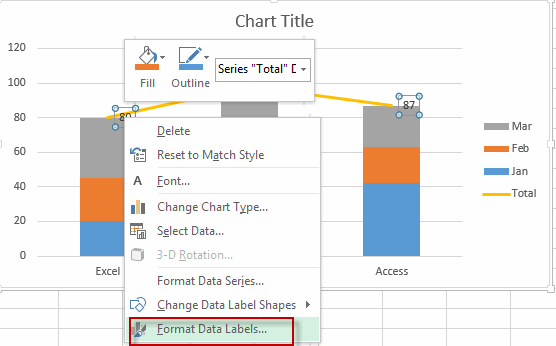
#7 click the new data labels to select it, and right click on it, and select Format Data Labels from the pop-up menu list. The Format Data Labels dialog will open.
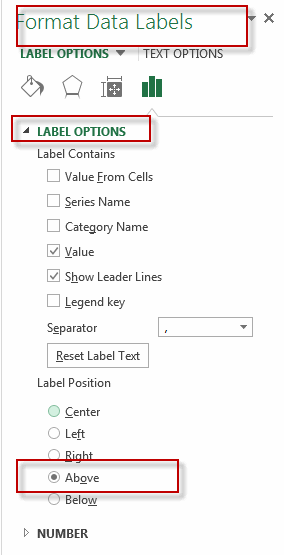
#8 click Label Options tab, and select Above radio button under Label Position section. click Close Button.
#9 the Total Labels have been added into this stacked column chart.
Leave a Reply
You must be logged in to post a comment.