This post will guide you how to add a comment to a data point in an excel chart. How do I add a comment into a data point of chart or graph in excel.
1. Adding comment to A Data Point in a Chart
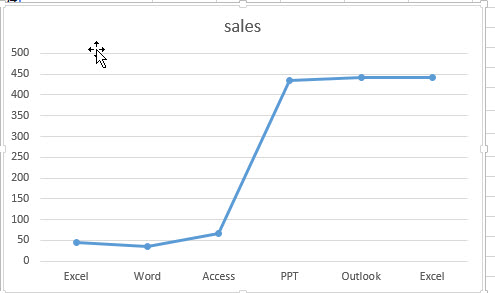
For example, if you have created a line chart in your current worksheet like as below:
Then you want to add one comment for a data point in the line chart. Just do the following steps:
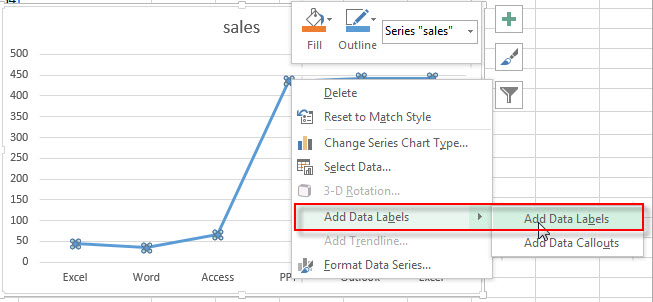
#1 right click on a certain data point, click Add Data Labels from the drop down list. Then select Add Data Labels.
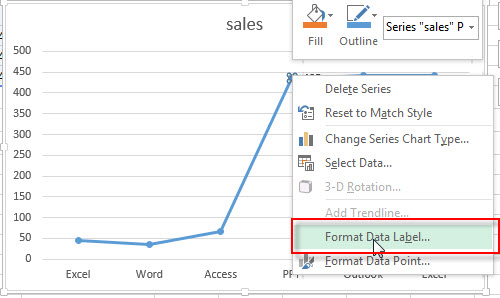
#2 right click on the data label, select Format Data Label… from the pop-up menu list.
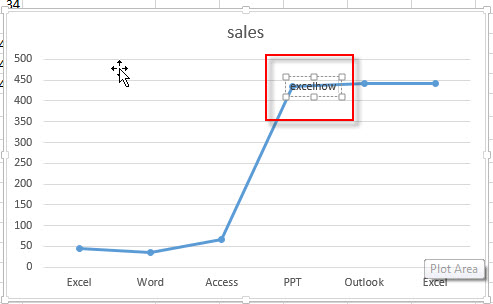
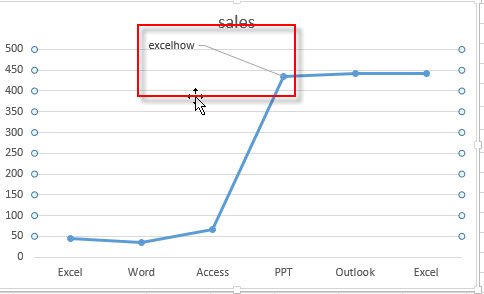
#3 add comment “excelhow” in the data label
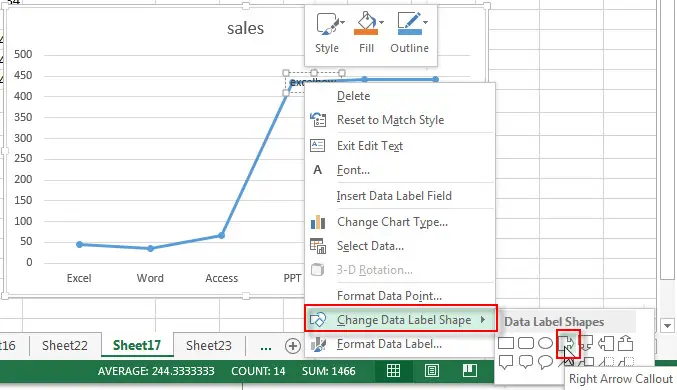
#4 right click on the data label again, select Change Data Label Shape, then select one data label shapes, such as: Right Arrow Callout.
#5 you will see that a comment has been added into the data label of data point in this line chart.
You can format the data label to customize its appearance and location on the chart.
Leave a Reply
You must be logged in to post a comment.