This post will guide you how to create a step chart in your current worksheet. How to create a step chart based on the common line chart in excel. and what is a step chart? the step chart is used to show the changes that occur at irregular intervals in excel. and it is different with the line chart. the line chart will connect the data points in such a way that you see a trend. and a step chart will focus to show the exact time of change in the data along with the trend.
Create Step Chart Based on the exact date
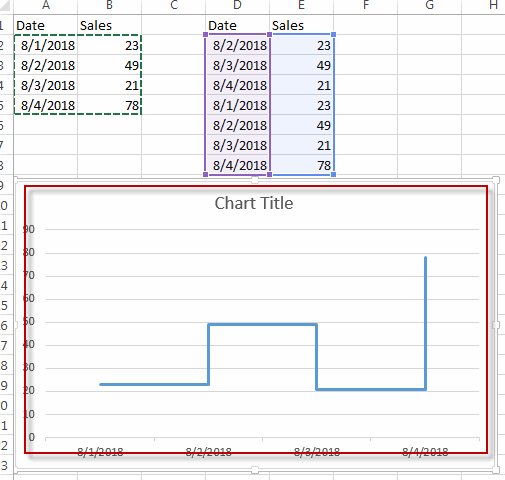
Assuming that you have a list of data in the range A1:B5 and the first column contain the exact date and another column contain rate number. You can refer to the following steps to create a step chart based on these data.
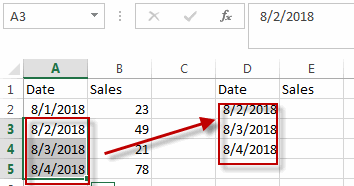
#1 you need to create a new data table based on the original data range (A1:B5),copy date values from the range of cells A3:A5, and paste those data into another new column or range of cells D2:D4.
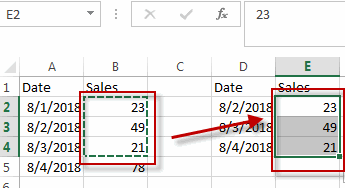
#2 continue to copy the rate values from the range of cells B2:B4, and paste these data into the range of cells E2:E4.
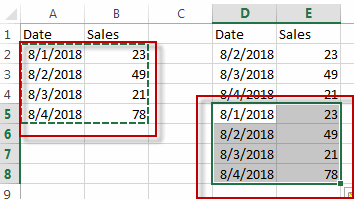
#3 copy all original data in the range of cells A2:B5 and then paste these data in the new data range .
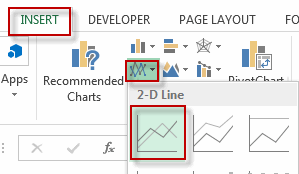
#4 go to INSERT tab, click Insert Line or Area Chart command, then select 2-D Line Chart .
#5 you will see that a step chart has been created .
Leave a Reply
You must be logged in to post a comment.