This post will guide you how to create a speedometer chart based on data in Excel. How do I create a gauge chart in Excel 2013/2016.
Create Speedometer Chart
Assuming that you have a list of data in range A1:B4, and you want to create a speedometer chart to track a single data point against its target. And you just do the following steps:
#1 select the cell A5 and type the Total in it, and then type the formula =SUM(B1:B4) in cell B5 to get the total number of the above 4 cells.
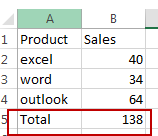
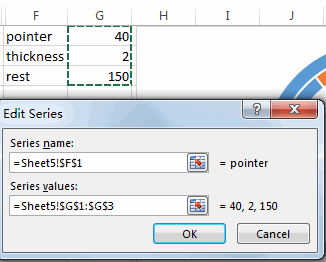
#2 create a new table in range F1:G3 that contain values which used to create the pie chart for the needle. And the pointer value is the value which you want to track in the speedometer chart.

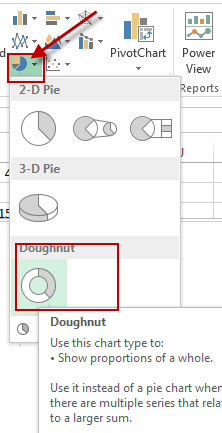
#3 go to INSERT tab, click Insert Pie or Doughnut Chart command under Charts group, and click Doughnut from the popup menu list.
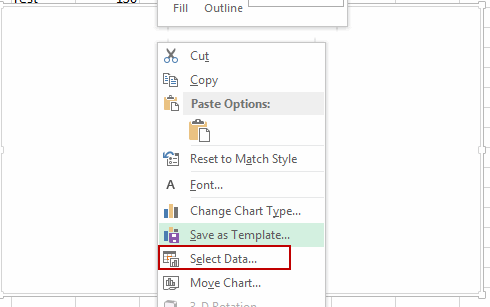
#4 right click on the chart, and click on Select Data from the popup menu list. And the Select Data Source dialog will open.
#5 click Add button under Legend Entries section, and the Edit Series dialog will open.
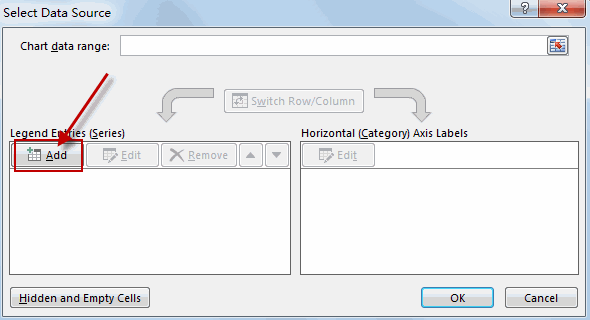
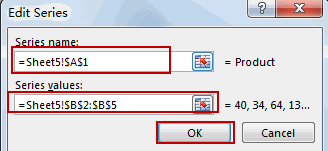
#6 type one Series name, or you can select cell A1 as series name. And select the range B2:B5 as Series Values, click Ok button. A doughnut chart has been created like below:
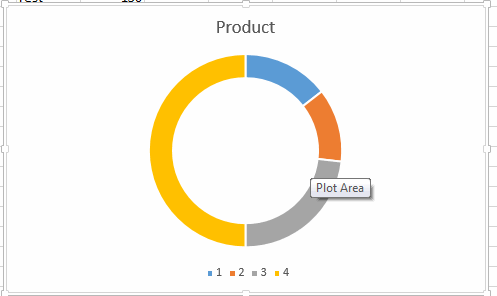
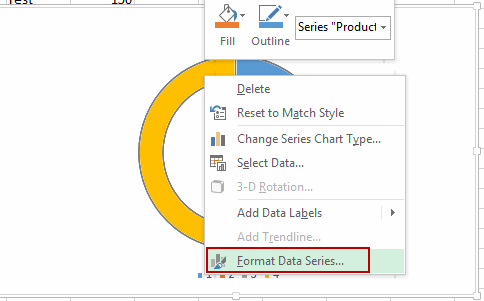
#7 right click on the chart and then click Format Data Series from the popup menu list. And the Format Data Series pane will open.
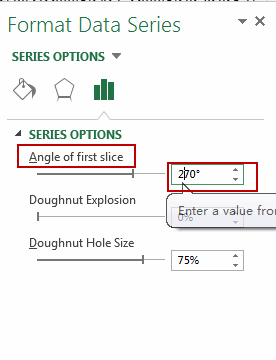
#8 type 270 in Angle of first slice text box and press enter key in your keyboard.
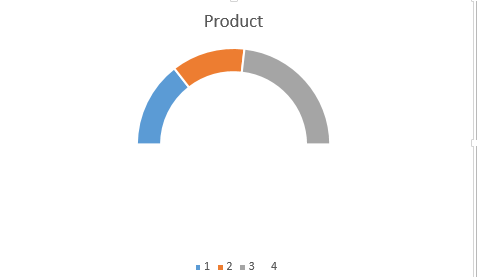
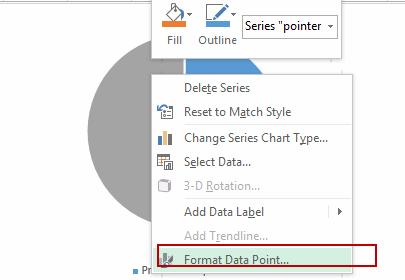
#9 you need to hide the below half of the chart, and select only that part of the chart and right click on it, and select Format Data Point, and the Format Data Point pane will open.
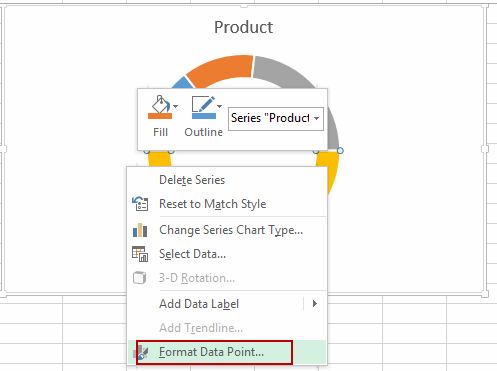
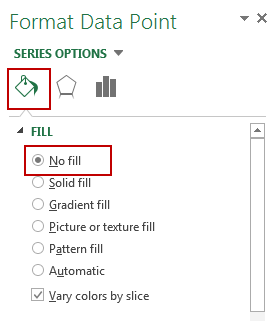
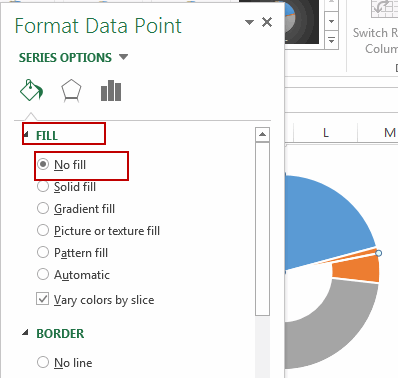
#10 switch to Fill&Line tab, and select No fill under Fill section.
#11 right click on the chart and then click on Select Data again. And click Add button under Legend Entries section. Select the cell F1 as Series name, and select range G1:G3 as Series values, click OK button.
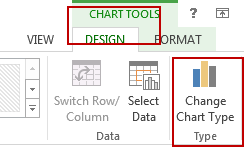
#12 select the second chart and go to CHART TOOLS – > DESIGN tab, click Change Chart Type command under Type group. The Change Chart Type dialog will open.
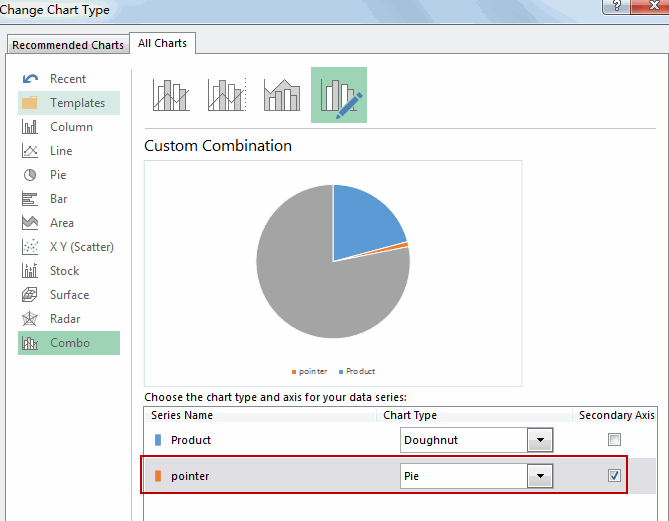
#13 in Combo section, select pie chart for Pointer as Chart Type, and check Secondary Axis option. Click OK button.
#14 select both of the large data parts of the chart and then right click on it to select Format Data Point, and click Fill&Line tab, check No Fill in Fill section.
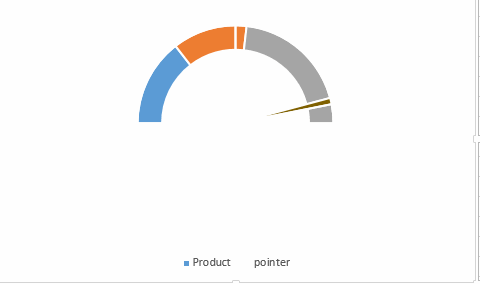
#15 let’s see that last result.
Video: Create Speedometer Chart
Leave a Reply
You must be logged in to post a comment.