This post will guide you how to create a radar chart in your worksheet in Excel. How do I create a spider chart in Excel.
Create Radar Chart
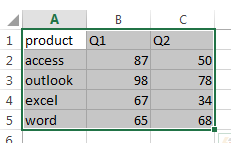
Assuming that you have a list of data in range A1:C5, and you want to create a radar chart based on those data. How to achieve it. Just do the following steps:
#1 select the range of cells that you want to create radar chart.

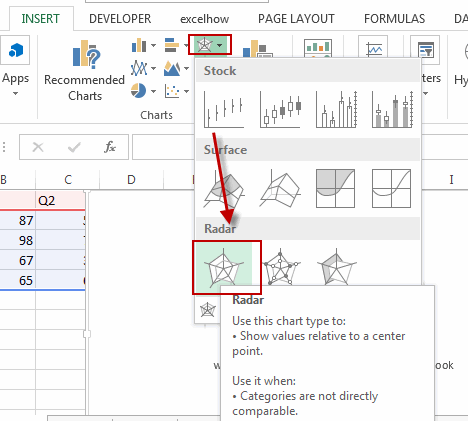
#2 go to INSERT tab, click Insert Stock, Surface or Radar Chart command under Charts group. And select Radar in drop down list.

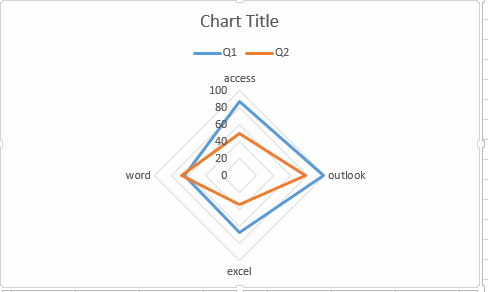
#3 a radar chart based on the selected range of cells has been created.

Leave a Reply
You must be logged in to post a comment.