After the chart is generated, it will appear at random place in your worksheet. How do I place the generated chart into a specified position in excel. And this post will guide you how to write down an excel VBA Macro to set chart absolute position in your worksheet.
Setting Chart Position
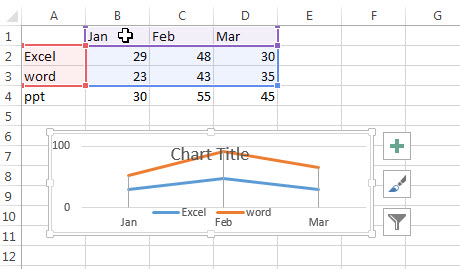
Assuming that you have create a chart and it is placed at random position by default. Of course, you can move the chart to any position by dragging the chart. And if you want to move the chart to a certain position via VBA, just do the following steps:
#1 select the chart that you want to set position.
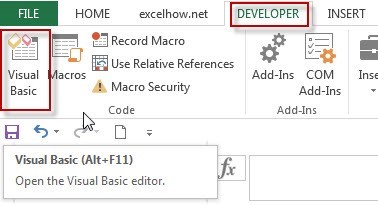
2# click on “Visual Basic” command under DEVELOPER Tab.
3# then the “Visual Basic Editor” window will appear.
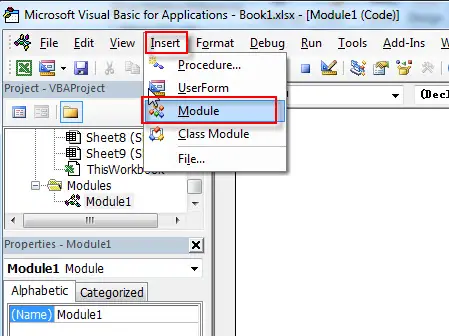
4# click “Insert” ->”Module” to create a new module.
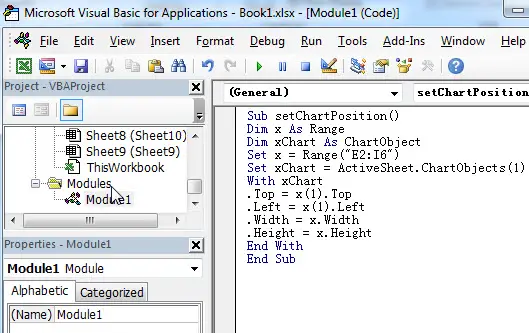
5# paste the below VBA code into the code window. Then clicking “Save” button.
6# back to the current worksheet, then run the above excel macro. Click Run command.
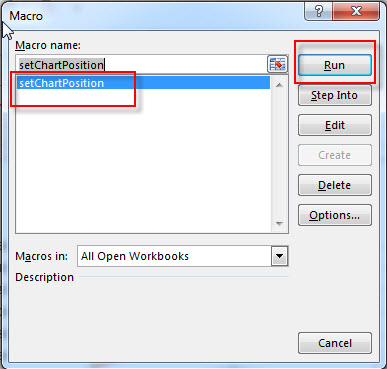
7# Let’s see the result.

Leave a Reply
You must be logged in to post a comment.